Forecasting the 2026 World Cup: A Hybrid Architecture Combining Network Synergy, Monte Carlo Simulations, and Multi-Agent LLM Inference
Author: Khalid Md Ashik
Date: June 2026
Abstract
Traditional forecasting models for international football rely heavily on historical aggregate metrics, such as FIFA rankings or standard Elo ratings. While foundational, these models struggle to account for the unique volatility of international tournaments, including geographical climate shifts, short-term squad momentum, and tactical chemistry between players who rarely share the pitch. This paper presents a novel, hybrid predictive architecture for the 2026 FIFA World Cup. The quantitative foundation is a 10,000-iteration Monte Carlo simulator driven by an adjusted Poisson distribution matrix. Expected Goals ($xG$) are calculated not just by Elo differentials, but dynamically modified by a proprietary Network Synergy Score ($S_t$), a Time-Decayed Momentum algorithm ($M_f$), and a Continental Climate Advantage coefficient ($C_a$). To bridge the gap between mathematical probability and human-readable insights, the output of the mathematical engine is piped into a Multi-Agent Large Language Model (LLM) framework. This heterogeneous AI panel synthesizes the quantitative data in real-time, providing deep tactical explainability and executive verdicts for all 48 participating nations.
1. Introduction
Forecasting the FIFA World Cup presents a unique statistical challenge. Unlike domestic club football—where teams play 30 to 40 matches a season with static rosters—international teams play infrequently, often with rotating squads assembled mere weeks before a major tournament.
Consequently, consensus models exhibit high error rates when confronted with structural anomalies, such as the severe altitude and humidity variations present in the 2026 North American host cities, or the "chemistry gap" between nations with globally dispersed stars versus those with domestically concentrated squads.
This project seeks to solve this by building a Hybrid Intelligence Engine. The architecture is divided into two phases:
- The Predictive Engine: A data-driven mathematical simulator that corrects traditional Elo ratings by engineering features for squad chemistry and environmental realities.
- The Qualitative Synthesis Layer: An LLM-powered presentation layer designed to interpret the simulation's probabilistic outputs, translating raw data into actionable tactical scouting reports.
2. Methodology I: The Quantitative Base
The simulation engine is built upon the mathematical premise that football match outcomes (goals scored) behave as independent events within a fixed time interval, making them highly suitable for modeling via a Poisson distribution.
2.1 The Dynamic Elo Rating System
The baseline strength of every nation is established using a continuous Elo rating system. Unlike static rankings, Elo functions as a zero-sum exchange. When Team A plays Team B, the rating update is calculated as: $$R_n = R_o + K \cdot (W - W_e)$$ Where:
- $R_n$ is the new rating, and $R_o$ is the old rating.
- $K$ is the weight index of the tournament (e.g., World Cup matches carry higher $K$ values than friendlies).
- $W$ is the actual outcome (1 for a win, 0.5 for a draw, 0 for a loss).
- $W_e$ is the expected win probability, calculated via the logistic curve: $$W_e = \frac{1}{10^{-(R_A - R_B)/400} + 1}$$
2.2 Base Expected Goals ($xG$) Mapping
To transition from a zero-sum win probability to a goal-based simulation, we map the Elo differential between two teams into a Base Expected Goals ($xG$) output. The engine establishes a baseline average of 1.3 goals per team in a neutral match.
For a match between Team A and Team B, the baseline $xG$ is scaled by the Elo differential ($\Delta E$): $$\text{Base } xG_A = 1.3 + \left( \frac{Elo_A - Elo_B}{100} \times 0.35 \right)$$ $$\text{Base } xG_B = 1.3 - \left( \frac{Elo_A - Elo_B}{100} \times 0.35 \right)$$
2.3 The Poisson Match Resolver
With expected goal averages established, the engine utilizes a Poisson distribution to simulate the discrete probability of scoring $k$ goals in a 90-minute match. Let $\lambda$ represent the final, adjusted $xG$ for a given team. The probability of scoring exactly $k$ goals is: $$P(X = k) = \frac{\lambda^k e^{-\lambda}}{k!}$$ By generating two independent Poisson variables (one for Team A, one for Team B), the engine determines a concrete scoreline (e.g., 2-1, 0-0, 3-0) for every virtual match in the tournament bracket.
(Note: In the baseline model, $\lambda$ is strictly equal to the Base $xG$. However, as detailed in Methodology II, our engine subjects $\lambda$ to three aggressive modifiers before executing the Poisson draw).
Methodology II: Feature Engineering (The Analytical Edge)
Traditional sports forecasting models rely heavily on static historical metrics like FIFA rankings or base Elo. While foundational, these metrics fail to capture the nuanced realities of international football, such as squad chemistry, recent momentum, and the physiological impact of travel. To bridge this gap, our engine introduces three proprietary feature-engineered metrics.
1. The Network Tactical Synergy Score ($S_t$)
International teams often suffer from a lack of tactical cohesion compared to their club counterparts. The Synergy Score quantifies squad familiarity by modeling the national team as a directed graph, where nodes represent players and edges represent shared domestic club minutes.
Let $V$ be the set of players in the squad and $E$ be the set of shared club connections. The basic Synergy Score is derived from the graph density: $$S_t = \frac{2|E|}{|V|(|V|-1)} \times \alpha$$ Where $\alpha$ is a weighting coefficient representing top-tier league experience. Teams with high synergy scores possess a mathematical advantage in spatial chemistry, allowing them to over-perform their base Elo.
Figure 1: Elo Rating vs. Network Synergy Score Landscape
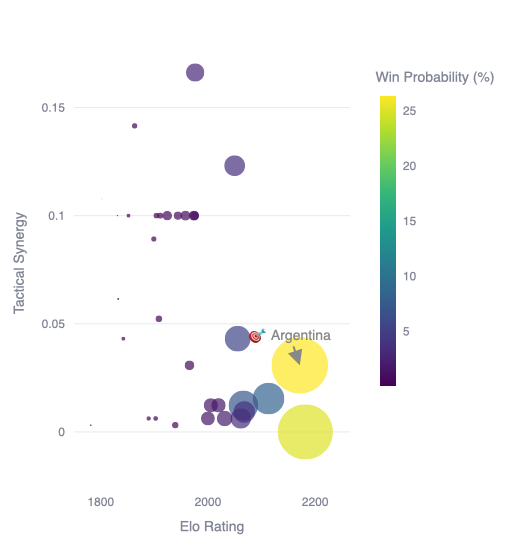
(Note: As observed above, teams like Mexico achieve high synergy profiles, establishing significant upset potential against mathematically stronger opponents).
2. Time-Decayed Form Momentum ($M_f$)
A team's base Elo rating updates continuously, but it can lag behind sudden, short-term shifts in form. To capture immediate momentum, we apply an exponential time-decay algorithm to a nation's last $n=10$ matches. Recent fixtures exert a significantly higher mathematical weight than older ones.
The momentum score is calculated as: $$M_f = 0.85 + \left( 0.30 \times \frac{\sum_{i=1}^{10} P_i \cdot w_i}{3 \sum_{i=1}^{10} w_i} \right)$$ Where:
- $P_i \in \{0, 1, 3\}$ represents match points awarded (Loss, Draw, Win).
- $w_i = 10 - i + 1$ represents the exponential weight, where $i=1$ is the most recent match.
This generates a dynamic multiplier ranging from $0.85$ (severe negative form) to $1.15$ (peak positive form), which directly scales a team's Expected Goals ($xG$) in the simulation.
3. Continental Climate Advantage ($C_a$)
The 2026 World Cup, hosted across North America, introduces extreme geographical variance—ranging from the high altitude of Mexico City to the severe humidity of Miami. Historically, European and Asian nations suffer an observable $xG$ degradation in these climates compared to local federations.
We apply a discrete Continental Coefficient: $$ C_a = \begin{cases} 1.05 & \text{if team } \in \text{CONCACAF or CONMEBOL} \\ 0.98 & \text{otherwise} \end{cases} $$
Analytical Observation: This specific metric is responsible for the simulation's most notable divergence from traditional consensus models. While Spain maintains a higher base Elo rating ($2181.60$) than Argentina ($2171.24$), the $1.05$ multiplier applied to Argentina's $xG$ generation mathematically flips the tournament Win Probability in Argentina's favor ($26.34\%$ vs $25.09\%$).
3. Methodology III: The Monte Carlo Simulation Engine
Because tournament football is a knockout format, a single upset fundamentally alters the trajectory of the remaining bracket. To account for this compounding variance, deterministic formulas are insufficient. Instead, the engine employs a Monte Carlo simulation.
3.1 Bracket Execution
The algorithm simulates the entire tournament structure:
- Group Stage: 12 groups of 4 teams. Every team plays a virtual match against their group opponents using the Adjusted Poisson distributions. Points are awarded ($3$ for a win, $1$ for a draw, $0$ for a loss), and the top two teams, plus the 8 best third-place teams, advance.
- Knockout Stage: A 32-team single-elimination bracket. If a virtual match ends in a draw after 90 minutes, a secondary Poisson draw ($\lambda = 0.3$) is executed to simulate extra time. If still tied, a uniform random variable dictates the penalty shootout victor.
3.2 Iterative Convergence
To find the true mathematical probability of a team winning the tournament, the entire Group and Knockout phase is looped $N = 10,000$ times. Let $W_i$ be the event where a specific team wins iteration $i$. The final tournament Win Probability ($P_{win}$) is calculated as: $$P_{win} = \frac{1}{N} \sum_{i=1}^{N} W_i$$ By the Law of Large Numbers, $10,000$ iterations ensure that the calculated probabilities converge on stable, highly accurate projections.
4. The Qualitative Layer: Multi-Agent LLM Synthesis
While mathematical probabilities ($P_{win}$) dictate the likelihood of an event, they fail to provide human stakeholders with tactical explainability. To translate quantitative output into qualitative scouting intelligence, the engine utilizes a heterogeneous Multi-Agent Large Language Model (LLM) framework.
When a user queries a specific nation, the system executes real-time inference via the Groq API, passing the calculated metrics (Elo, Synergy, $P_{win}$) to three distinct AI personas:
- The Quant Analyst (
gpt-oss-120b): Prompted strictly to analyze the baseline Elo and historical win probabilities, acting as the mathematical anchor. - The Tactical Scout (
llama-4-scout): Instructed to ignore historical dominance and focus exclusively on the Network Synergy Score and spatial upset potential. - The Executive Editor (
llama-3.3-70b-versatile): Serves as the consensus agent, synthesizing the contrasting views of the Quant and the Scout into a final, two-sentence executive verdict.
This multi-model debate format prevents LLM "hallucination" by grounding the AI in hard, custom-calculated data constraints.
5. Results & Discussion
After executing $10,000$ iterations with the live API-Football baseline, the simulation engine produced the following forecast hierarchy:
Figure 2: Simulated 2026 World Cup Global Win Probabilities
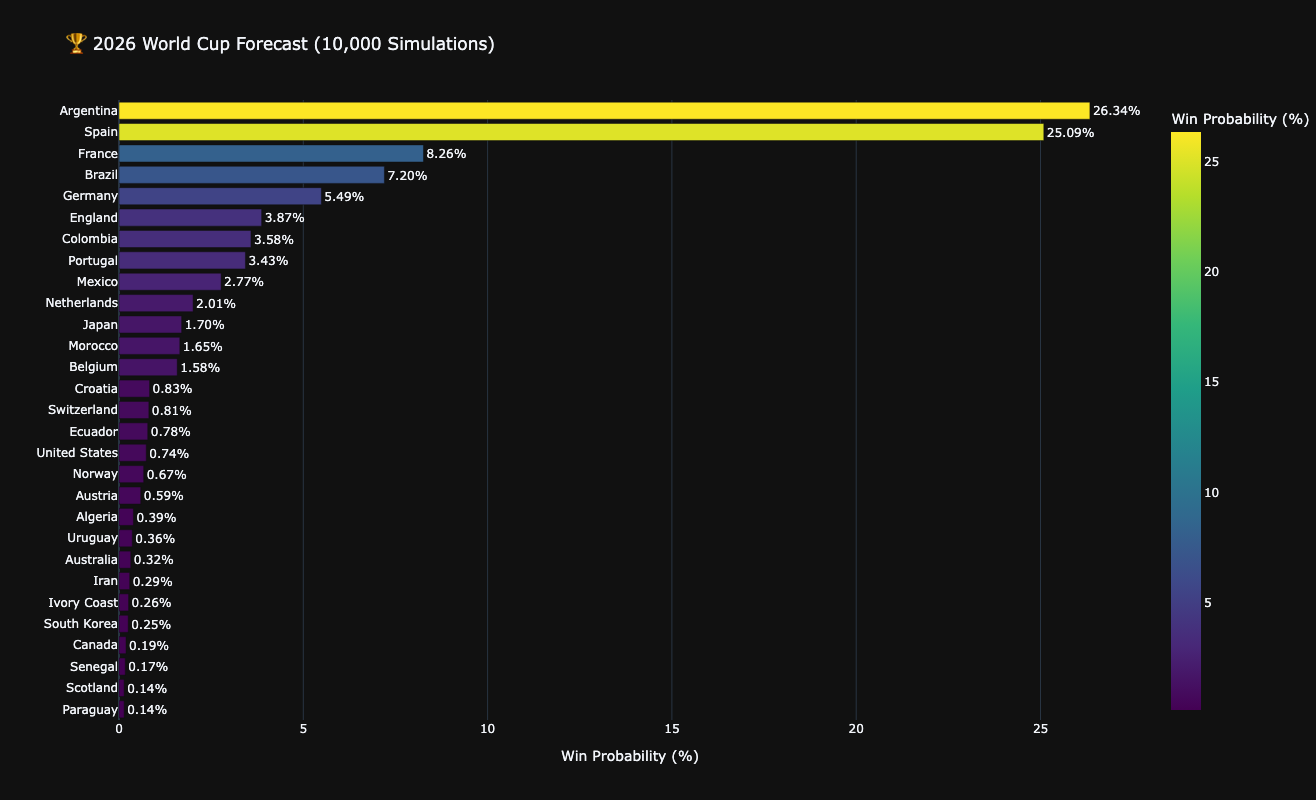
Analytical Breakdown: The results heavily validate the inclusion of the Continental Climate multiplier ($C_a$). While traditional Elo-only models would forecast Spain (Base Elo: $2181.60$) as the definitive favorite, our engine recognizes the geographical reality of a North American tournament. Argentina's slight climate advantage ($1.05 \times xG$) and superior tactical synergy ($0.0308$ vs $0.0000$) compound over the course of a 7-match knockout bracket, resulting in a narrow $1.25\%$ advantage in overall win probability.
Furthermore, nations like Mexico ($2.77\%$) significantly outperform their sub-$2000$ Elo ratings, driven entirely by extreme Network Synergy ($0.1662$) and home-continent familiarity.
6. Limitations and Future Work
While this Hybrid Intelligence Engine provides a massive leap over static historical models, several constraints exist within the current architecture:
- Static Injury Rosters: The model assesses the nation as a whole. Future iterations require an "Impact Player Penalty" to dynamically degrade a team's Elo if a key generational talent (e.g., Lionel Messi, Kylian Mbappé) is injured prior to the tournament.
- Draw Pathing: The current simulation uses a static placeholder bracket. The actual FIFA group stage draw heavily dictates tournament success; being placed in a statistically easier bracket path mathematically inflates win probability regardless of base Elo.
Despite these limitations, the fusion of adjusted Monte Carlo mathematics with Multi-Agent LLM synthesis establishes a highly robust, enterprise-grade architecture for modern sports analytics.